A. In the video, First steps in computer vision, Laurence Maroney introduces us to the Fashion MNIST data set and using it to train a neural network in order to teach a computer “how to see.” One of the first steps towards this goal is splitting the data into two groups, a set of training images and training labels and then also a set of test images and test labels. Why is this done? What is the purpose of splitting the data into a training set and a test set?
- For a computer to “see” an image and correctly identify that image, a model must be created by training the computer’s neural network on a set of training data and then testing its accuracy on test data. The data is split into testing and training images/labels so that the neural network can use one set (the training set) to “learn” what each image is labeled as. The neural network then uses what it knows to be correct from the training set to create a model to predict what future images should be labeled as. However, the model then can’t be tested for accuracy on the same training set because it already knows what those images are supposed to depict. Consequently, the neural network must have a separate training set of images on the side so that we can evaluate it’s ability to accurately predict labels for images it has never seen before.
B. The fashion MNIST example has increased the number of layers in our neural network from 1 in the past example, now to 3. The last two are .Dense layers that have activation arguments using the relu and softmax functions. What is the purpose of each of these functions. Also, why are there 10 neurons in the third and last layer in the neural network.
- The first layer in our neural network “flattens” the image data into a one-dimensional array before passing the data on to the next layer. In the second layer, containing 128 neurons, the “relu” activation argument sets negative neuron outputs to zero. In other words, “relu” removes negative outputs. Doing so helps keep future positive neuron outputs from being cancelled out by any previous negative neuron outputs. In the third and final layer, the “softmax” activation argument helps find the most likely classification label candidate. The “softmax” function is used in the final layer of neural networks because it makes the final determination about the probability of each classification. There are 10 neurons in this third and final layer because these correspond to each of the ten types of clothing classificiation possibilities. In short, these ten neurons will determine the probability that the image represents each of the ten clothing items.
C. In the past example we used the optimizer and loss function, while in this one we are using the function adam in the optimizer argument and sparse_categorical-crossentropy for the loss argument. How do the optimizer and loss functions operate to produce model parameters (estimates) within the model.compile() function?
-
The optimizer of a neural network adjusts settings (e.g., the learning rate) of the model based on the data it receives and the most recent value of the loss function. By acknowledging the previous loss value, the optimizer function can produce parameters within the model.compile() function that yield a smaller loss value and, thus, a more accurate model on the next epoch. I visited this website to learn more about the “adam” optimizer: Adam Optimizer Description. I learned that the “adam” optimizer function is a “adaptive learning rate method” that uses momemts of gradient to adjust the learning rate of the model.
In this particular neural network, the loss function is set to “sparse_categorical-crossentropy” to determine the cross entropy loss between the correct classification labels and the predicted classification labels, where there are multiple classifcation labels that are also represented as integers. Cross entropy loss seeks to minimize the entropy between the probability distribution of the actual classification label (where P(correct label) = 1 and P(every other label) = 0) and the probability distribution of the predicted classification label (i.e., P(predicted label) + P(every other label) = 1). I thought this website gave a nice explanation of cross entropy: Cross Entropy Loss Description. The more confident and accurate the model is in its classification decision, the lower the cross entropy. Consequently, the model seeks to minimize the sparse categorical cross entropy in order to make better, more accurate predictions. More generally, model parameters are produced within the model.compile() function that minimize the specified loss.
D. Using the mnist drawings dataset (the dataset with the hand written numbers with corresponding labels) answer the following questions:
1. What is the shape of the images training set (how many and the dimension of each)?
- I calculated the length of the images training set and determined that there are 60,000 images in the set, with a dimensionality of 28x28 pixels.
2. What is the length of the labels training set?
- I calculated the length of the labels training set and determined that there are 60,000 labels in the set. The label training set’s length is the same as the length of the images training set because there is only one label that correctly classifies each image.
3. What is the shape of the images test set?
- I calculated the length of the images test set and determined that there are 10,000 images in the set, with a dimensionality of 28x28 pixels.
4. Estimate a probability model and apply it to the test set in order to produce the array of probabilities that a randomly selected image is each of the possible numeric outcomes (look towards the end of the basic image classification exercises for how to do this — you can apply the same method applied to the Fashion MNIST dataset but now apply it to the hand written letters MNIST dataset).
-
I calculated an array of classification label probabilities for all test images, which can be seen on lines 44 and 46 in the corresponding “July8.py” file from my code repository.
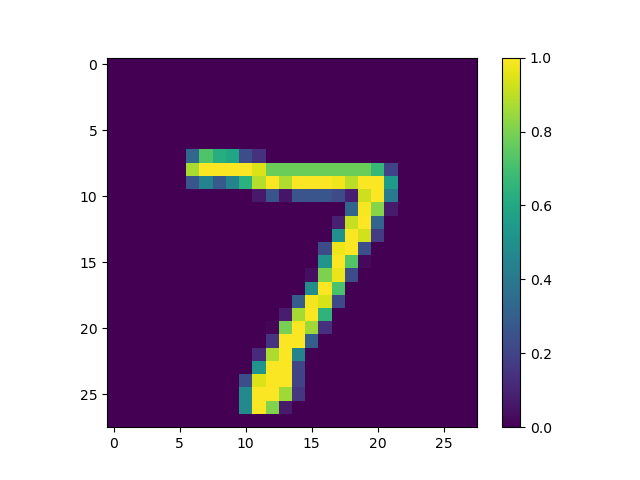
To give an example, I decided to randomly select the first test image to practice predicting its digit classifcation label. The digit classification label probabilites for the first test image’s prediction are the following: [ 1.7913088e-07, 1.6292073e-08, 3.4559532e-06, 2.6658881e-05, 2.8856678e-12, 2.8279874e-08, 9.9518761e-12, 9.9996901e-01, 1.5789774e-07, 4.9453018e-07 ]. The numbers in this list depict the probability that the digit in the first test image is a 0, 1, 2, 3, 4, 5, 6, 7, 8, or 9, respectively.
5. Use np.argmax() with your predictions object to return the numeral with the highest probability from the test labels dataset.
- Using the np.argmax() function on the first test image, the numeral/digit with the highest probability for this image is a 7. The image’s corresponding test label confirms that the first test image does, indeed, depict a 7. For reference, I have attached a plot of the first test image, below.

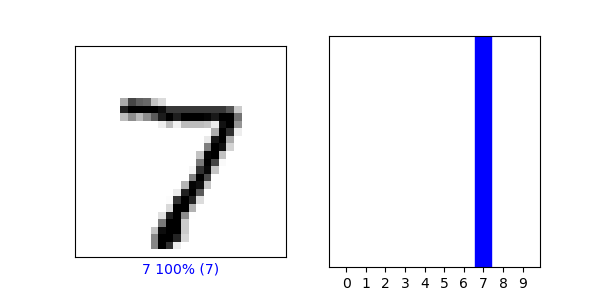
6. Produce the following plot for your randomly selected image from the test dataset:
- I have attached a plot depicting the first test image alongside it’s probability distribution, below. Interestingly, the model was so confident in its prediction that the first test image depicted a 7, that the remaining probabilities don’t even appear on the graph.
